Statistics Errors Graphing
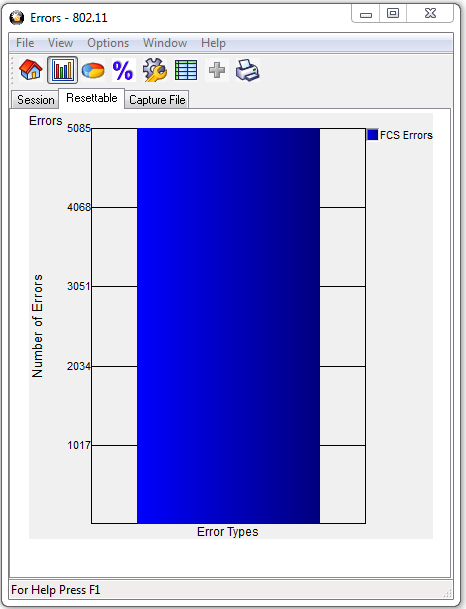
Selecting Graph Errors... from the Statistics window or clicking on ![]() in the Errors table header will open the Errors window.
in the Errors table header will open the Errors window.
The Errors window has Session, Resettable and Capture File tabs that correspond to the tabs on the Statistics window. Each tab shows the data that corresponds to the appropriate tab on the Statistics window.

HSU Errors Window
Errors Window Menus
| Menu | Selection | Hot-Key | Description |
|---|---|---|---|
| File | Print Graph | Ctrl-P | Prints the graph from the selected tab. |
| View | Toolbar | Checking displays the toolbar. | |
| Status Bar | Checking displays the status bar. | ||
| Control | Ctrl_Shift_C | Changes the focus to the Control window. | |
| Bar | Displays a bar graph in all tabs. | ||
| Pie | Displays a pie chart in all tabs. | ||
| Data Grid | Displays a table with both data and percentage values without regard to the data format of the charts. | ||
| Aggregate | Aggregates CH0 and CH1 errors into a single chart. When not selected, CH0 and CH1 errors are charted separately | ||
| Percent | Displays the charts as a percentage when selected. When not checked the chart is show as actual data. | ||
| Options | Graph Options | Alt-Enter | Opens a pop-up for changing the graph refresh rate. |
| Window | Close Window | Ctrl-Q | Closes the Errors window. |
| Help | Help Topics | Opens the ComProbe Help window. | |
| About ComProbe Protocol Analysis System | Provides a pop-up showing the version and release information, Frontline contact information, and copyright information. | ||
| Support on the Web | Opens a browser to fte.com technical support page. |
Errors Window Toolbar

|
Changes the focus to the Control window. |
|
|
When clicked the charts appear as bar charts. |
|
|
When clicked, the charts appear as pie charts. |
|
|
Displays all charts as a percentage. |
|
|
Opens a pop-up for changing the graph refresh rate. |
|
|
When clicked, a table is inserted with the chart showing actual error statistics and percent of errors. |
|
|
Aggregates CH0 and CH1 errors into a single chart. When not selected, CH0 and CH1 errors are charted separately. |
|
|
Prints the chart from the selected tab. |