Audio Waveform Panel
The Audio Waveform Panel displays the captured audio waveform. If the waveform is stereo, both channels are visible in the Wave Panel. The user can view the entire waveform or can zoom to view a portion of the waveform in more detail.
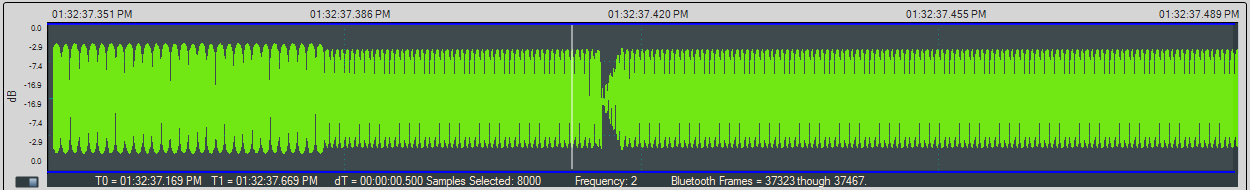
Audio Waveform Panel in the Wave Panel
| Control | Description |
|---|---|

|
Horizontal Zoom: Increases the amount of data that is visible on the screen; however, less detail is discernible. |

|
Horizontal Zoom: Decreases the amount of data that is visible on the screen; however, more detail is discernible. |
Waveform
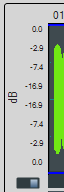
The audio waveform is plotted as amplitude versus time on the Wave Panel. The amplitude scale is located on the left edge of the Wave Panel. The waveform’s amplitude can be linear or in decibels. The linear range is -1.0 to +1.0. The range for the dB scale is 0 dB for the maximum positive and maximum negative values, and silence is negative infinity. A toggle switch at the bottom of the amplitude scale will switch between Linear scale and dB scale. Moving the switch to the left will display the Linear scale and moving it to the right will display the dB scale.
Play Cursor
The Play Cursor is identified by a white vertical line on the Wave Panel. The Play Cursor appears when user clicks on any point in the waveform, or, if the cursor is already present it can be dragged to another position. To drag the Play Cursor, hover the mouse cursor over the Play Cursor until the mouse cursor changes to a pointing hand; click and drag the cursor to a new position.
Waveform Segment Selection
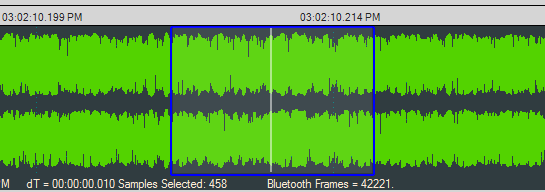
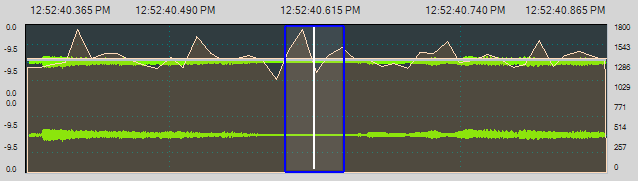
Selection in the Audio Waveform
A waveform segment selection is identified by a blue border surrounding the selection. Procedures for selecting a segment depend on the desired actions.
| Desired Action | Procedure |
|---|---|
| Loop play back |
1. Zoom in to the waveform segment of interest. 2. Click in the approximate center of the proposed selection. This will place the Play Cursor in the area to be selected. 3. Move the mouse cursor to the right or left of the Play Cursor, click and hold, then drag over the waveform segment of interest. Release the mouse key. The selection is surrounded by a blue border. |
| View waveform details |
1. Zoom in to the segment of interest. 2. Move the mouse cursor to the right or left limit of the waveform segment of interest; click and hold, then drag over the waveform segment of interest. Release the mouse key. The selection is surrounded by a blue border. |
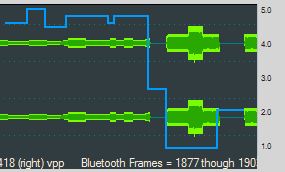
For either of the procedures described in the table above, once the selection is made details of the segment appear below and to the left of the waveform. These details include selection start and stop range ("T0" and "T1"), the time difference ("dT"), samples selected, frequency, and "Bluetooth Frames" selected.
Right-clicking in the Waveform panel will open a pop up menu (see "Wave Panel & Event Table Pop-up Menu". Selecting Zoom to Selection will expand the selection to the full width of the Wave Panel. Other selection option in the pop up are Select Area, Clear Selection, and Copy Selection.
Actual Bitrate Overlay Display
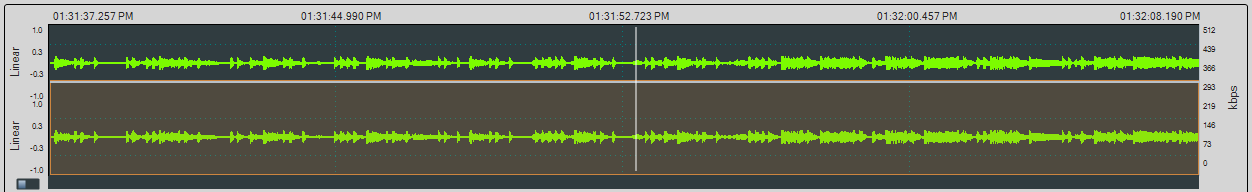
Actual Bitrate Overlay
The Average and Actual audio stream bitrate graphs can be displayed over the audio waveform using the Global Toolbar Average Bitrate Overlay  and Actual Bitrate Overlay
  buttons respectively. These are presented as overlays onto the main Wave Panel so the user can correlate audio issues with bitrate changes and the like. The scale is in kbps (kilo bits per second). Hovering over the bitrate scale will display a pop-up showing the bitrate at the play cursor position.
Actual Bitrate is based on the throughput at the Codec level.
The Average Bitrate is the moving average over 0.1 sliding-second window.
Average Bitrate Overlay
All of the information for calculating the Acutal and Average Bitrate is in the codec data frame header.
Audio Rating Metric (Referenced Mode Only)
The Audio Rating Metric is only available in referenced mode operation when a reference audio has been detected with a Test ID Found event. When the Audio Rating Metric button  on the Global Toolbar is activated, a metric scale appears on the right of the Audio Wave Panel and a blue graph line is overlaid onto displayed waveform. This graph represents an objective score of the captured audio compared to the original reference audio. The score is based on a set of six Audio Expert System™ real-time measurements that include, for example, the number of frequency resets. Individual scores are computed frequently for sub-second segments of reference mode audio; these segments can be as small as 50 milliseconds. Scores are computed for a frequency change, for silence, for multi frequency segments. or for level changes.
The Audio Rating Scale ranges from 1 to 5. " Audio Rating Metric Scale Interpretation" provides an interpretation of the major scale points in quality and in the hearer's perception of the difference between the reference signal and the playback. At a scale value of 5, the reference signal in the audio waveform panel would represent excellent quality because, when hearing the audio played, the difference between the playback and the original reference audio is imperceptible.
The Audio Rating Metric is best used for making relative comparisons and for localizing problem areas.