Frame Summary
View a one line high-level overview of each data frame/packet
using the Summary Pane . Select a protocol layer and the most
significant fields are displayed in a concise form. Selecting a
frame causes a detailed view to appear in the Frame Decode
pane. In order to facilitate troubleshooting, all panes are
adjustable in size and are synchronized - selecting a frame in
the Summary pane automatically updates the other panes, and
selecting an item in the Decode pane highlights the
corresponding bits or bytes in the other panes.
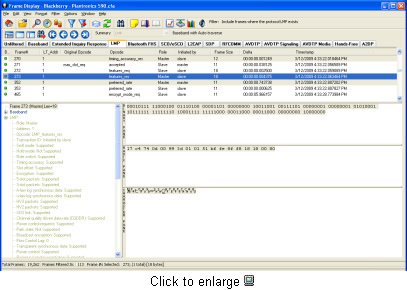
Frame Decode
View a comprehensive layered decode of each frame/packet through
the Decode Pane . Each field of a data frame is decoded
layer-by-layer using a tree structure, with clear, concise
descriptions. Selecting a field will automatically highlight the
associated bytes in binary, hex, and ASCII. Selecting an item in
the Decode pane will also highlight corresponding bits/bytes in
other panes.
Detailed Frame Analysis
View data at varying levels of granularity, from frame level to
bit level, on the Frame Display Window. Frames containing errors
are highlighted in red in the Frame Summary pane, indicating the
availability of detailed error analysis information in the Frame
Decode pane. The level of drill-down analysis detail and the
size of each drill-down pane are completely user controlled.
Since all FTS windows are synchronized, a range of events
selected in the Frame Display Window will also be selected in
all other FTS4BT windows and panes. Multiple Frame Display
windows can be opened simultaneously to allow users to view
different sections of the captured data.