Piconet View Pane (Experimental)
Note: At this time the Piconet View is in experimental. This topic provides a description of the anticipated Piconet View functionality.
Devices and connections detected by the Frontline hardware are displayed graphically on the Piconet View pane for further configuration and selection for analysis by the user. Devices and connections are displayed on the Piconet View pane only when data to or from those devices or connections has been detected by the Frontline hardware, while the appearance of devices in the Wireless Devices pane includes detected devices, user entered devices, and remembered devices.
Piconet View
Adjacent to each device in the view is the devices BD_ADDR
Attached to each dot is a label that displays BD_ADDR . The tab is colored either blue or green to indicate that the related device is Classic or low energy Bluetooth.
A blue ring surrounds the device that is either paging or serving as the master device in the piconet. In the event of a role switch, this blue ring will shift position to the new piconet master.
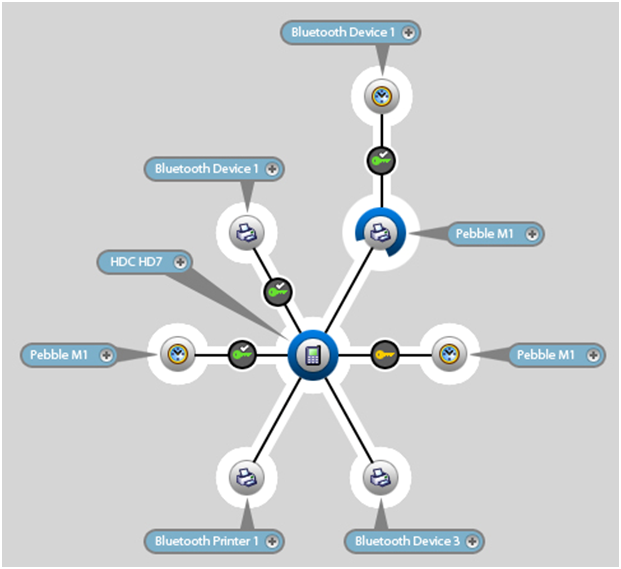 In the event of scatternet where one piconet master that is also a slave of a secondary piconet, the blue ring is “broken” in that roughly 25% of the ring is cut away to accommodate the slave’s position in primary piconet. The remaining 75% of the blue ring connects to the secondary piconet slave device.
Within the Piconet View, rolling the mouse over an icon will highlight that device or security information in the Wireless and Security panes.
Timeline

Piconet View Timeline
As device connections appear over time, the Timeline on the bottom of the Piconet View displays circles representing events over time where the piconet view has changed. Classic Bluetooth events appear as blue circles and Bluetooth low energy events appear as green circles. These events appear when devices:
- Connects - solid circles
- Role Switches - sold circles
- Disconnects - hollow circles
Select an event on the time line by clicking on an event circle.
The display on the Piconet View will change to the piconet configuration active at the selected event time allowing the user to trace piconet activity. A timeline cursor—a white vertical line—will appear behind the selected timeline event. Above the timeline cursor appears the event capture date and time.
Note: The timeline event cursor is always positioned in the center of the display. A selected event will move to the cursor, thus the selected event is always position in the center of the Piconet View.

On the timeline right end is the timeline duration and the zoom controls. The current duration of the visible timeline is shown in minutes (m) or seconds (s). The "+" and "-" controls will zoom in and zoom out the timeline, respectively. To show less of the timeline (more detail) click on the "+", and to show more of the timeline (less detail) click on the "-".