NetDecoder gathers and maintains important statistical information related
to the network being monitored. This information is crucial to debug and
troubleshoot communication problems on the industrial network.
The Statistics display window includes information that is relevant for
all networks. This information includes:
- Bandwidth Utilization data.
- Frame rate (Frames/second).
- Character or Byte rate (bytes/second).
- Frame/message size distributions.
- Error information.
Apart
from the above common information, NetDecoder also gathers data specific to
the properties of the industrial network being monitored. Some examples of
this include statistics for Ethernet,
ControlNet, DeviceNet and
DH+.
Ethernet Statistics
The statistics dialog for the Ethernet analyzer includes error
information supported by the NDIS drivers. Since not all errors are
supported by all NDIS drivers, the ones not supported are marked "n/a". Some
of the Ethernet errors statistics reported include:
-
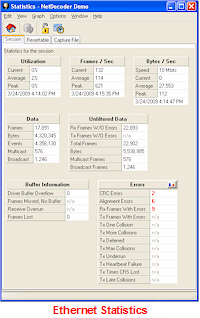 CRC errors.
- Alignment errors.
- Number of received frames with errors.
- Number of transmitted frames with errors.
- Number of frames successfully transmitted after detecting one
collision.
- Number of frames successfully transmitted after detecting multiple
collisions.
- Number of frames successfully transmitted after transmission has
been deferred at least once.
- Number of frames not transmitted due to excessive collisions.
- Number of frames not transmitted due to under-run errors.
- Number of frames transmitted without detecting the collision
detection heartbeat.
- Number of times carrier sense was lost during frame transmission.
- Number of collisions detected after the normal window.
To learn more about troubleshooting Ethernet networks, download a NetDecoder
demo. You can also order your
copy of NetDecoder online.
ControlNet Statistics
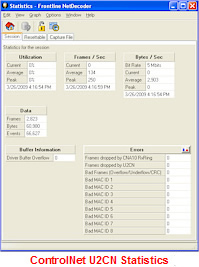 NetDecoder's ControlNet analyzer uses the 1784-U2CN or the 1784-PCC card
as the sniffer interface. The interface cards are designed around the
ControlNet CNA10 ASIC. The ControlNet analyzer gathers information about
frames dropped by the CNA10 ASIC. The protocol analyzer also provides the
number of frames that were dropped by the buffer in the 1784-U2CN device.
Other useful ControlNet related error information includes the number of bad
frames received and the MAC IDs of nodes transmitting bad frames. The
ControlNet analyzer maintains a list of the last eight MAC IDs that
transmitted bad frames.
NetDecoder's ControlNet analyzer uses the 1784-U2CN or the 1784-PCC card
as the sniffer interface. The interface cards are designed around the
ControlNet CNA10 ASIC. The ControlNet analyzer gathers information about
frames dropped by the CNA10 ASIC. The protocol analyzer also provides the
number of frames that were dropped by the buffer in the 1784-U2CN device.
Other useful ControlNet related error information includes the number of bad
frames received and the MAC IDs of nodes transmitting bad frames. The
ControlNet analyzer maintains a list of the last eight MAC IDs that
transmitted bad frames.
DeviceNet Statistics
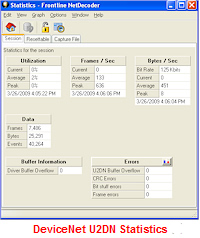 NetDecoder supports two options for running the DeviceNet analyzer. Users
can choose either Rockwell Automation's 1784-U2DN or SST's DeviceNet
interface cards. For both these interfaces, NetDecoder provides statistics
on
NetDecoder supports two options for running the DeviceNet analyzer. Users
can choose either Rockwell Automation's 1784-U2DN or SST's DeviceNet
interface cards. For both these interfaces, NetDecoder provides statistics
on
- CRC errors.
- Bit-stuff errors and error flags.
- Firmware buffer overflows (U2DN or SST interface).
- Frame errors.
To learn more about troubleshooting ControlNet or DeviceNet networks, download a NetDecoder
demo. You can also order your
copy of NetDecoder online.
DH+ Statistics
NetDecoder's DataHighway-Plus analyzer includes a special "Dashboard
View". This presents statistics on:
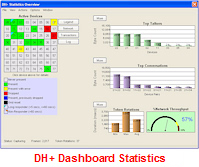 Busy tokens.
- Total bytes sent.
- Event log.
- Token rotations.
- Top listeners.
- Top talkers.
- Top conversations.
Another unique feature of NetDecoder's Statistics display is multiple
tabs on the Statistics dialog. All the screenshots above show three tabs in
the dialog. These tabs are named "Session", "Resettable" and "Capture File".
Information about all data collected since the analyzer was started is
shown in the Session tab. The Session tab cannot be reset; in this sense, it
is like the odometer on a car. The odometer on a car shows you all the miles
driven since the car was built, and the Session tab shows you all the data
collected since the analyzer was started.
If you think of the Session tab as the odometer, then the Resettable tab
is the trip odometer. It can be reset, and allows you to record statistics
for a new "trip". In this way you can effectively start a new session
without having to restart the analyzer.
The Capture File tab shows information on the data that is currently in
the capture. Occasionally some of the statistics read n/a, for Not
Available. This happens for various reasons. For example, many of the items
on the Capture File tab become not available (n/a) if the buffer becomes
full and wraps. When this happens, the analyzer can no longer provide
accurate statistics for the data in the file, because some of the data that
the statistics are based on has been lost.
To learn more about diagnosing and troubleshooting industrial
networks order your
copy of NetDecoder online.