| 1. |
The NetDecoder software now supports
Rockwell Automation's Data Highway Plus to USB Cable
(1784-U2DHP).
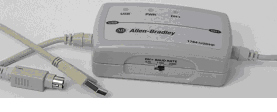
1784-U2DHP DH+ to USB Interface cable |
| 2. |
Customers using the DL-3500 to interface to DH+ buses can
now use Frontline's RS-232 ComProbe II to capture the RS-232
serial output from the DL-3500. |
| 3. |
The NetDecoder software supports the new 'Ethernet ComProbe'.
The Ethernet ComProbe is an Ethernet tap that can passively
monitor Ethernet traffic without the need for managed
switches or making complex changes to network configuration.
The tap sends captured data to the analysis PC via a USB
port.
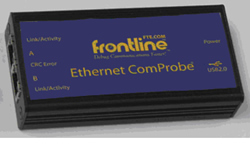
Ethernet ComProbe |
| 4. |
The NetDecoder software includes updated protocol decoders
for the IEC 60870-5-101, 60870-5-103 and 60870-5-104
protocols. These decoders are now a standard part of the
NetDecoder product. |
| 5. |
Modbus decoders have been updated to handle special radio
characters. |
| 6. |
This version also fixes some important timestamp bugs
related to the RS-232 ComProbe II and the RS-422/485
ComProbe. top |
| 1. |
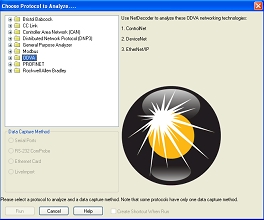
NetDecoder now has an improved start-up
wizard with detailed information to help users pick the
right option.
 |
| 2. |
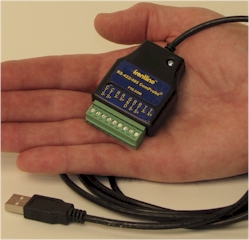
NetDecoder now supports the new "RS-422/485 ComProbe". This
device can capture Asynchronous RS-422/485 data and connects
to the analysis PC via USB.
 |
| 3. |
The ControlNet analyzer using Rockwell Automation's 1784-PCC
interface card has been updated to fix bugs and improve
performance. |
| 4. |
NetDecoder now includes improved Modbus decoders that
improve Master-Slave node identification. |
| 5. |
The ControlNet and CIP decoders have been improved. This
release fixes some decoder bugs that were reported by
customers. |
| 6. |
The DH+ statistics plugin has been improved to automatically
reload data when the decoders are reloaded. top |
| 1. |
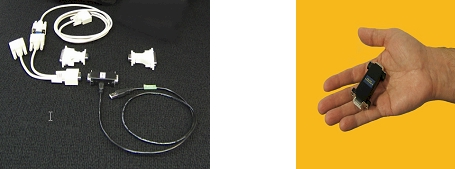
NetDecoder now supports a new serial-to-USB
interface device for sniffing RS-232 serial data. The new
device is called the "RS 232 ComProbe II" and comes with an
RS-232 monitoring cable set.
 |
| 2. |
The ControlNet analyzer using Rockwell Automation's
1784-U2CN Net interface device now includes Capture Filters,
Start and Stop triggers. |
| 3. |
Improved statistics for the ControlNet analyzer including
information about frames dropped by the CNA10 ASIC, frames
dropped by the U2CN, number of bad frames and the MAC IDs of
nodes transmitting bad frames. |
| 4. |
The DeviceNet analyzer using Rockwell Automation's 1784-U2DN
DeviceNet interface device now provides Start and Stop
triggers. |
| 5. |
Improved statistics for the DeviceNet analyzer including
information about CRC errors, Bit-stuff errors, U2DN buffer
overflows and frame errors. |
| 6. |
Improved DNP3 over Ethernet decoders to support fragmented
frames. top |
| 1. |
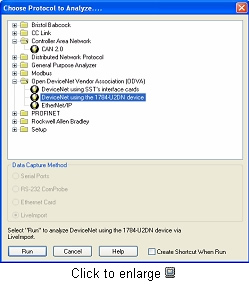
Frontline's NetDecoder analyzer now supports
DeviceNet protocol analysis using Rockwell Automation's
new1784-U2DN to USB interface device. This data capture
option can be selected in the start-up wizard under the
"Open DeviceNet Vendor Association (ODVA)" directory.
|
| 2. |
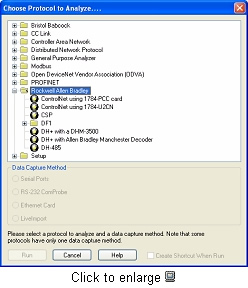
Frontline's NetDecoder analyzer now supports
ControlNet protocol analysis using Rockwell Automation's
1784-PCC card or the new 1784-U2CN to USB interface device.
Either of these two data capture options can be selected in
the start-up wizard under the "Rockwell Allen Bradley"
directory.
|
| 3. |
The existing support for SST-Woodhead's DeviceNet interface
card has been updated to include the following features:
- The SST card is not automatically put online. The
card goes online only when the user hits the "Start"
button. When the user clicks the 'Stop' button the card
is put offline.
- The existing device settings have been moved from
the "Hardware Settings" dialog to the "I/O Settings
dialog".
- The users can access the "I/O settings" dialog in a
capture session and change the settings.
- The "I/O Settings" dialog also includes the
DeviceNet capture filters tab.
- The "I/O Settings now has two additional trigger
options:
- The user can select to "Put interface offline in
Bus Warning condition". Whenever the analyzer
detects a Bus Warning condition it puts the device
offline to prevent the entire network from going
into a bus off condition.
- The "I/O Settings" also has a "Noise trigger"
that can stop data capture whenever a CAN
communication error is detected.
- The timestamps on the Frame Display are displayed in
micro-second resolutions.
- The "CAN" protocol tab in Frame Display has
pre-defined summary columns.
|
| 4. |
The start-up wizard has an additional option for CAN
protocol analysis using SST-Woodhead's DeviceNet interface
cards.
- The "I/O Settings" dialog provides the user with
options for changing device settings as well as for
defining CAN capture filters.
|
| 5. |
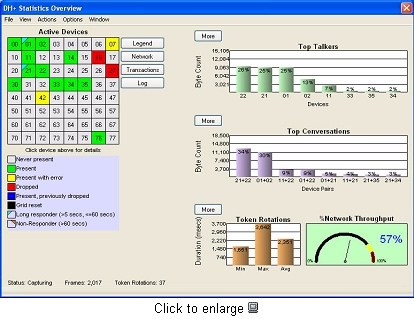
The DH+ Statistics display has been improved in terms of
both performance indicators and a more user-friendly
display. Includes more detailed information on individual
node performance along with "Network Throughput"
information.
|
| 6. |
NetDecoder now supports decoders for CC-Link IE (Ethernet)
protocol. top |
| 1. |
Frontline is pleased to announce the release
of a new feature for our communications analyzers which will
provide copy protection along with the ability to move/park
the software license. This feature will be included in the
Serialtest®, Ethertest®, MeshDecoder™, and NetDecoder™
analyzers. The release of these analyzers with copy
protection will occur in early September. |
| 2. |
The Frontline copy protected software can be
activated via the Internet, with manual browser activation
or with manual activation via email request or a telephone
call to Frontline. More detailed information on the license
protection functionality and activation options is available
in a separate document. (Installing, Activating, and
Managing Frontline Test System (FTS) Products. This
NetDecoder version captures communications to a single file
or to a series of files. By default, the analyzer comes
ready to capture to a single file, but the file size
selection and the capture to a series of files selection can
be viewed by clicking on Options and then Systems Settings.
Control
Window with Network View and New Dashboard Buttons
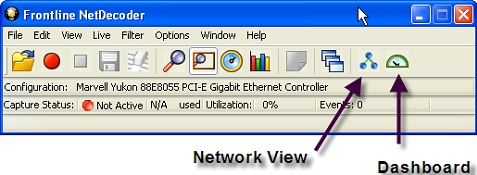 |
| 3. |
View the video for the Ethernet Network
View feature. |
| 4. |
View the new Dashboard video. Key
Dashboard View features:
- Provides a high level view of the key Ethernet
network activities.
- Includes a 10-minute history of network utilization,
statistics on the top talkers (with a histogram for high
traffic activities).
- A speed meter with background color change alert for
high network utilization.
- A meter to show bad packets percentage.
- A meter to show the top talker percentage.
- A chart for protocol specific activity.
- User-defined alarms with email notification will
define a group of allowable IP addresses and NetDecoder
will let you know when an unauthorized IP address is
detected.
As a reminder, the NetDecoder
Communications Analyzer is a passive Ethernet network
monitoring software which works through the Network
Interface Card in most PCs. |
| 1. |
This NetDecoder version captures
communications to a single file or to a series of files. By
default, the analyzer comes ready to capture to a single
file, but the file size selection and the capture to a
series of files selection can be viewed by clicking on
Options and then Systems Settings. Control
Window with Modified Save Functionality
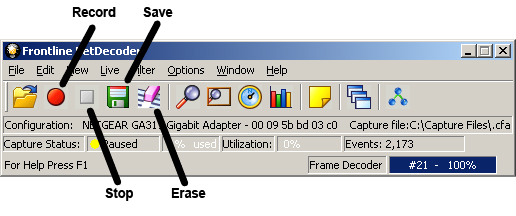 |
| 2. |
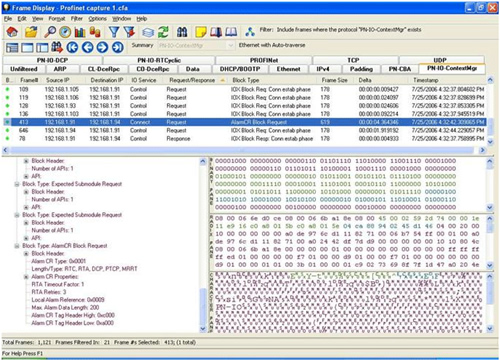
Also included in this version is decoding
for ProfiNet communications traffic. ProfiNet communications
decoding is presented in an easy to view format. This format
assists in easily understanding what is being communicated
along with powerful filtering to get at the section of the
communications traffic that you want to view. When combined
with the Network View and Dashboard View functionality,
NetDecoder becomes a powerful network diagnostic tool.
 |
| 3. |
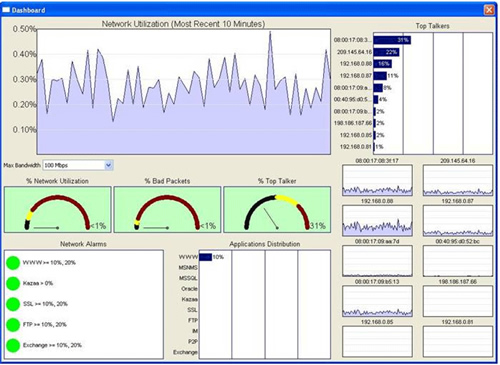
In addition to the customer requested
Network View, which was released in August, is the new
Ethernet Dashboard View. The Dashboard View provides a high
level view of the key activities occurring on the Ethernet
communications network. Key features of this release
includes a 10-minute history of network utilization,
statistics on the top ten talkers (with a histogram for
each), a speed meter with background color change alert for
high network utilization, a meter to show bad packets
percentage and a meter to show the top talker percentage.
Also included is a chart for specific protocol activity.
User-defined alarms with email notification will be coming
in the next version. The Dashboard includes user definable
alarms with e-mail notification when an alarm is triggered.
You may define a group of allowable IP addresses and
NetDecoder will let you know when an unauthorized IP address
is detected.
As a reminder, the NetDecoder
Communications Analyzer is a passive Ethernet network
monitoring software which works through the Network
Interface Card in most PCs. top |
| 1. |
To upgrade from 5.1
to any new version contact sales for a new serial number. |
| 2. |
NetDecoder's new "Ethernet Network View" enables you to see
the statistics on specific nodes, including communications
traffic details and node information on all active nodes on the
monitored side of the switch. Selectable views enable you to see
Packets Transmitted and Received, Bytes Transmitted and
Received, IP Addresses, MAC Addresses and more. You can even
give each node a "User- Friendly Name" (such as PLC#2, Pump
Station #2, etc.). |
| 3. |
Training videos on NetDecoder's Network View and
NetDecoder Analyzer functionality are available to view in the
NetDecoder section of this website. |
| 4. |
A ControlNet Decoder is now included in the
NetDecoder
decoder library. |
| 5. |
NetDecoder now has compatibility with Internet Protocol
Version 6 (IPv6). It adds many improvements to IPv4 in areas
such as routing and network auto-configuration. |
| 6. |
As the result of customer feedback, you will
also notice in this version that Frontline has updated the
tool bar Icons in most displays. Some Icons have been
changed to more closely represent their function. |
| 7. |
New enhancements have been made to "print"
capability.
The new print capability gives you options for printing out
information in NetDecoder's Frame Display. Selecting options,
as shown in the above screen shot of NetDecoder's Frame Display
Print feature, results in a print-out as illustrated in the
Print Preview screen shot below. You can also choose an option
so that the print-out includes the decode information for each
Frame number |
| |
Other Features (Introduced with v7.2.1) |
| 8. |
NetDecoder has a new interface for
launching the desired sniffer. |
| 9. |
Right-click filtering is now available. |
| 10. |
Display filter results are now placed into a tab on Frame
Display and as a Named Frame Filter on Protocol Navigator. |
| 11. |
Event Display Export to HTML, CSV or text format - HTML and
text formats look as similar as possible to the Event Display
window. |
| 12. |
A View install is supported by all products. |
| 13. |
A Demo install is supported by all products. |
| |
Other Features (Introduced with v5.1 |
| 14. |
DH+ ( Data Highway Plus) Statistics Module: The new
DH+ statistics module truly analyzes and summarizes both your
individual nodes and the network traffic generated by those
nodes. Features include:
- Active Devices and Health of Devices
- Top Talkers, Top Listeners and Top Conversations
- Token Rotation Time, Token Utilization and Time Token
Held
- Device Response Times
- Event Log that lists problems seen on the network
|
| 15. |
DeviceNet Support: The new DeviceNet decoder supports
DeviceNet Objects with class and instance sizes of 8/8, 8/16,
16/8, and 16/16. The analyzer must be connected to the network
when the master devices first establish their connection
parameters with each slave device for explicit unconnected
messages. This allows auto discovery of the class and instance
parameters so that responses can be properly decoded. Otherwise,
all class and instance sizes default to 8/8. top |
For further information regarding
pre-release software and protocol decoders, please contact our sales
department at (800) 359-8570 or +1 434-984-4500 or send email to
[email protected].