Event Display
To open this window click the Event Display icon  on the Control
window
toolbar.
on the Control
window
toolbar.
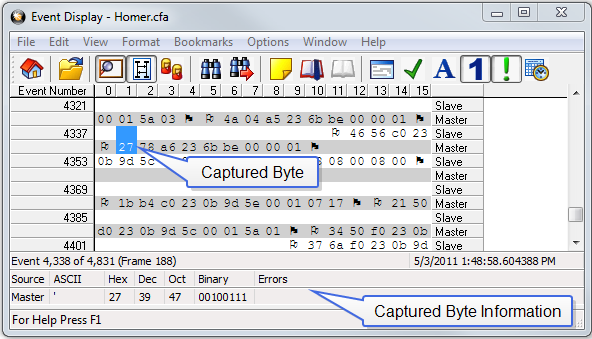
The Event Display window provides detailed information about every captured event. Events include data bytes, data related information such as start-of-frame and end-of-frame flags, and the analyzer information, such as when the data capture was paused. Data bytes are displayed in hex on the left side of the window, with the corresponding ASCII character on the right.
Event Display
Click on an event to find out more about it. The three status lines at the bottom of the window are updated with information such as the time the event occurred (for data bytes, the time the byte was captured), the value of the byte in hex, decimal, octal, and binary, any errors associated with the byte, and more.
Events with errors are shown in red to make them easy to spot.
When
capturing data live, the analyzer continually updates the Event Display
as data is captured. Make sure the Lock icon  is displayed
on the toolbar to prevent the display from updating (Clicking on the icon
again will unlock the display). While
locked, you can review your data, run searches, determine delta time intervals
between bytes, and check CRCs. To resume updating the display, click the
Lock icon again.
is displayed
on the toolbar to prevent the display from updating (Clicking on the icon
again will unlock the display). While
locked, you can review your data, run searches, determine delta time intervals
between bytes, and check CRCs. To resume updating the display, click the
Lock icon again.
You can have more than one Event Display open at a time.
Click the Duplicate View icon  to create a second, independent
Event Display window. You can lock one copy of the Event Display and analyze
your data, while the second Event Display updates as new data is captured.
to create a second, independent
Event Display window. You can lock one copy of the Event Display and analyze
your data, while the second Event Display updates as new data is captured.
Event Display is synchronized with the Frame Display