Coexistence View – Timelines
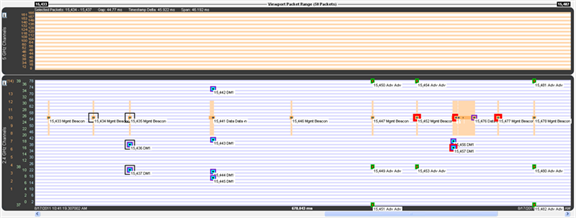
Coexistence View Timelines
The Timelines show Classic Bluetooth® , Bluetooth low energy, and 802.11 packets by channel and time.
Packet information
Packet information is provided in various ways as described below.
Packets are color-coded to indicate attribute (Retransmit, Bad Packet, Can’t Decrypt, or Invalid IFS), master/Tx, technology (Classic Bluetooth® , Bluetooth low energy, or 802.11), and category/type.
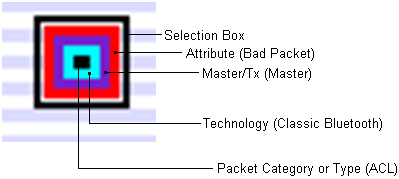
Each packet is color-coded
The innermost box (which indicates packet category/type) is the packet proper in that its vertical position indicates the channel, its length indicates the packet’s duration in the air, its left edge indicates the start time, and its right edge indicates the end time.
The height of Classic Bluetooth and Bluetooth low energy packets indicates their frequency range (1 MHz and 2 MHz respectively). Since 802.11 channels are so wide (22 MHz), 802.11 packets are drawn with an arbitrary 1 MHz height and centered within a separate frequency range box which indicates the actual frequency range.
Selecting a packet by clicking on it draws a selection box around it (as shown above) and highlights the applicable entries in the legend.
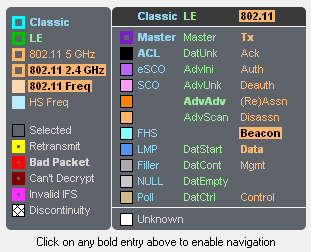
Highlighted entries in the legend for a selected packet.
Summary information for a selected packet is displayed in the timeline header.

Timeline header for a single selected packet.
When multiple packets are selected (by dragging the mouse with the left button held down, clicking one packet and shift-clicking another, or clicking one packet and pressing shift-arrow), the header shows Gap (duration between the first and last selected packets), Timestamp Delta (difference between the timestamps, which are at the beginning of each packet), and Span (duration from the beginning of the first selected packet to the end of the last selected packet).

Timeline header for multiple selected packets
Text can be displayed at each packet by selecting Show Packet Number, Show Packet Type, and Show Packet Subtype from the Format menu.
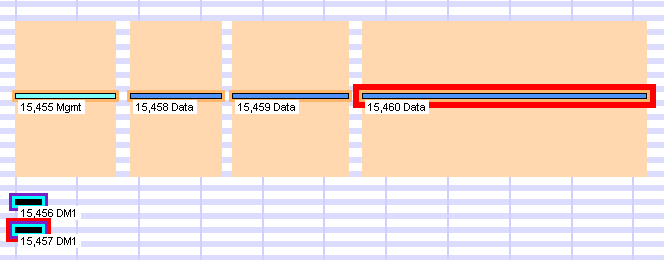
Descriptive text on timeline packets.
Placing the mouse pointer on a packet displays a tooltip (color-coded by technology) that gives detailed information.
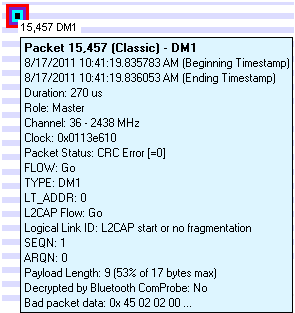
A tool tip for a Classic Bluetooth packet.
Relocating the tool tip
You can relocate the tool tip for convenience or to see the timeline or throughput graph unobstructed while displaying packet information. In the Format menu select Show Tooltips in Upper-Left Corner of Screen, and any time you mouse-over a packet the tool tip will appear anchored in the upper-left corner of the computer screen. To return to viewing the tool tip adjacent to the packets deselect the tool tip format option in the menu.
View Format Menu image...
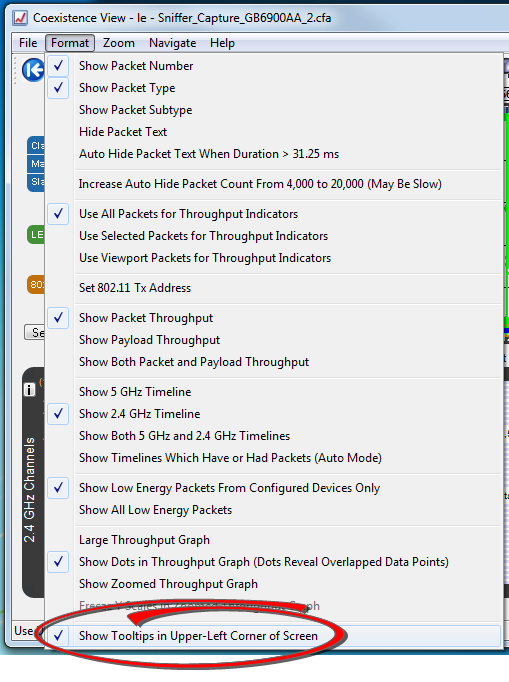
Coexistence View Format Menu - Show Tooltips on Computer Screen
View Tool Tip Anchored to Computer Screen image...
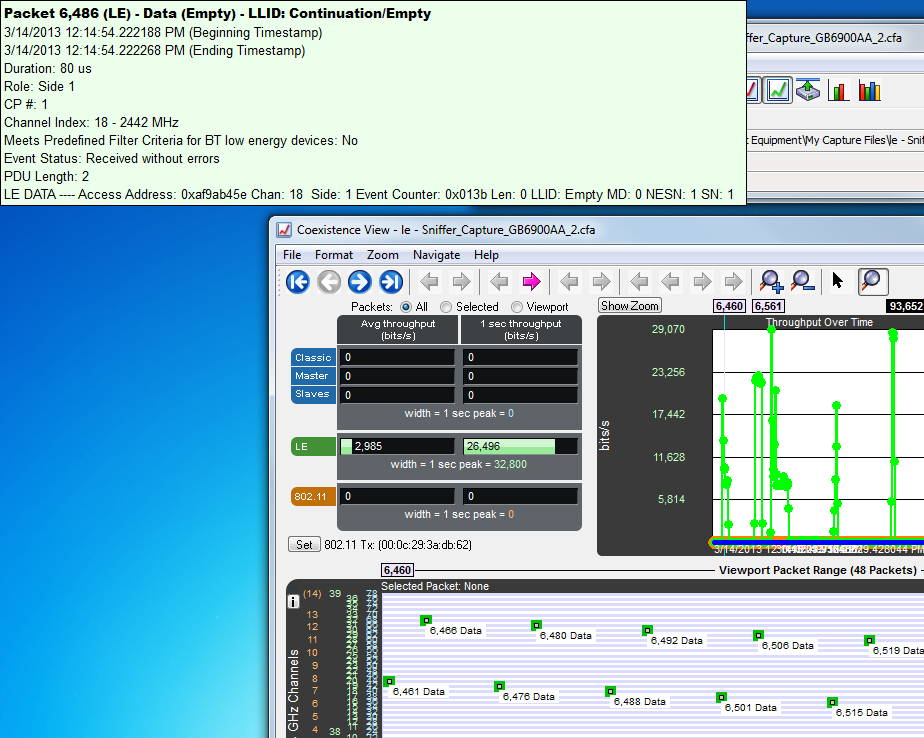
Coexistence View Timeline Tool Tip Shown Anchored to Computer Screen
The two Timelines
There are two Timelines available for viewing, one for the 5 GHz range and one for the 2.4 GHz range. Classic Bluetooth and Bluetooth low energy occur only in the 2.4 GHz range. 802.11 can occur in both.
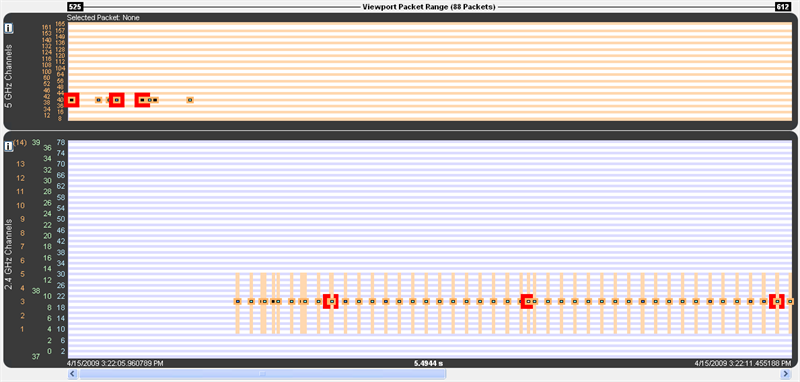
5 GHz and 2.4 GHz 802.11 packets
The y-axis labels show the channels for each technology and are color-coded: Blue = Classic Bluetooth, Green = Bluetooth low energy, Orange = 802.11.
The 5 GHz timeline has only 802.11 channel labels, and the rows alternate orange and white, one row per channel.
The 2.4 GHz timeline has labels for all three technologies. The rows alternate blue and white, one row per Classic Bluetooth channel. The labels going left-to-right are 802.11 channels, Bluetooth low energy advertising channels, Bluetooth low energy regular channels, and Classic Bluetooth channels.
The Viewport Packet Range above the timelines shows the packet range and packet count of packets that would be visible if both timelines were shown (i.e. hiding one of the timelines doesn’t change the packet range or count). This packet range matches the packet range shown above the viewport in the Throughput Graph, as it must since the viewport defines the time range used by the timelines. When no packets are in the time range, each of the two packet numbers is drawn with an arrow to indicate the next packet in each direction and can be clicked on to navigate to that packet (the packet number changes color when the mouse pointer is placed on it in this case).
An arrow points to the next packet when no packets are in the time range.
An arrowed packet number changes color when the mouse pointer is on it. Clicking navigates to that packet.
The header shows information for packets that are selected.
The footer shows the beginning/ending timestamps and visible duration of the timelines.
The ‘i’ buttons bring up channel information windows, which describe channel details for each technology. They make for interesting reading.

5 GHz information window
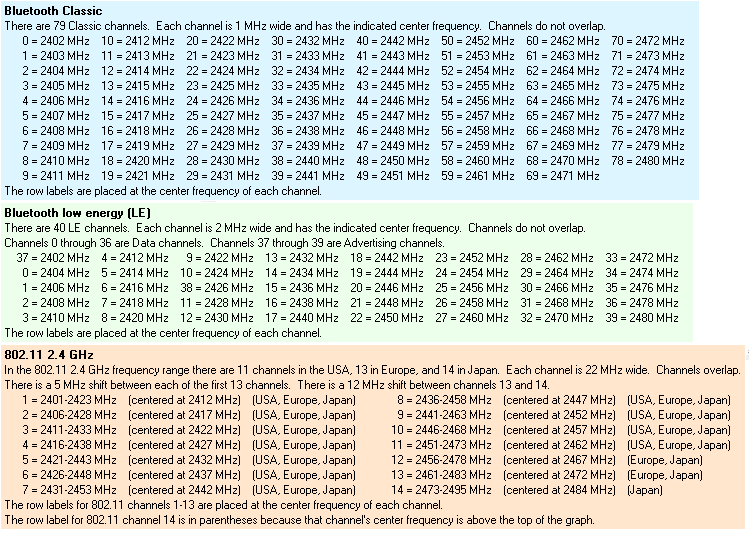
2.4 GHz information windows
Bluetooth slot markers
When zoomed in far enough Bluetooth slot markers appear in the 2.4 GHz timeline. A Bluetooth slot is 625 µs wide.
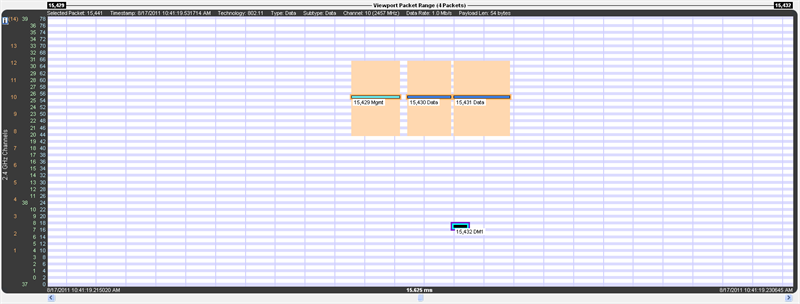
Vertical blue lines are Bluetooth slot markers
Zooming
- Drag one of the sides of the Throughput Graph viewport.
- Select a zoom preset from the Zoom or right-click menus.
- Select the Zoom In or Zoom Out button or menu item.
- Turn the mouse wheel in the Timelines or the Zoomed Throughput Graph while the zoom cursor is selected. The action is the same as selecting the Zoom In and Zoom Out buttons and menu items except that the time point at the mouse pointer is kept in place if possible.
- Select the Zoom to Data Point Packet Range menu item, which zooms to the packet range shown in the most recently displayed tool tip.
- Select the Zoom to Selected Packet Range menu item, which zooms to the selected packet range as indicated in the Selected Packets text in the timeline header.
- Select the Custom Zoom menu item. This is the zoom level from the most recent drag of a viewport side, selection of Zoom to Data Point Packet Range, or selection of Zoom to Selected Packet.
The zoom buttons and tools step through the zoom presets and custom zoom, where the custom zoom is logically inserted in value order into the zoom preset list for this purpose.
Discontinuities
A discontinuity is when the timestamp going from one packet to the next either goes backward by any amount or forward by more than 4.01 s (this value is used because the largest possible connection interval in Bluetooth low energy is 4.0 s). A discontinuity is drawn as a vertical cross-hatched area one Bluetooth slot (625 µs) in width. A discontinuity for a timestamp going backward is called a negative discontinuity and is shown in red. A discontinuity for a timestamp going forward by more than 4.01 s is called a positive discontinuity and is shown in black. A positive discontinuity is a cosmetic nicety to avoid lots of empty space. A negative discontinuity is an error.
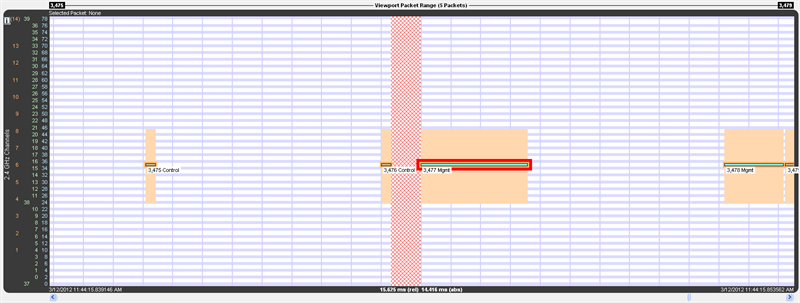
A negative discontinuity
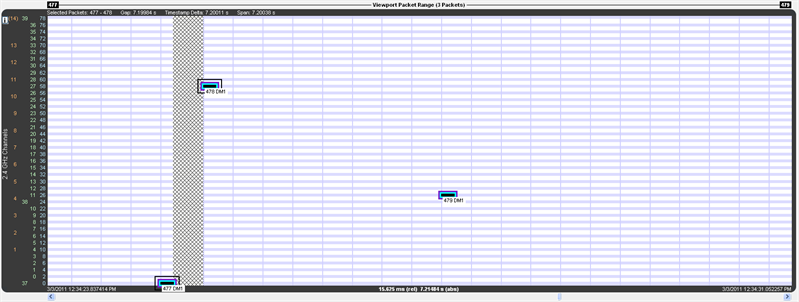
A positive discontinuity
When there are one or more discontinuities the actual time encompassed by the visible timeline differs from the zoom level duration that would apply in the absence of any discontinuities. The actual time, referred to as absolute time, is shown followed by “(abs)”. The zoom level duration, referred to as relative time, is shown followed by “(rel)”. When there are no discontinuities, relative and absolute time are the same and a single value is shown.

Timeline header with discontinuity

Timeline duration footer with discontinuity
For example, the timeline above has a zoom level duration of 15.625 ms (the relative time shown in the footer). But the discontinuity graphic consumes the width of a Bluetooth slot (625 µs), and that area is 7.19984 s of absolute time as shown by the Gap value in the header. So the absolute time is 7.21484 s:
Zoom level duration – Bluetooth slot duration + Gap duration =
15.625 ms - 625 µs + 7.19984 s =
0.015625 s – 0.000625 s + 7.199840 s =
0.015000 s + 7.199840 s =
7.214840 s =
7.21484 s
High-Speed Bluetooth
High-speed Bluetooth packets, where Bluetooth content hitches a ride on 802.11 packets, have a blue frequency range box instead of orange as with regular 802.11 packets (both are shown below), and the tool tip has two colors, orange for 802.11 layers and blue for Bluetooth layers.
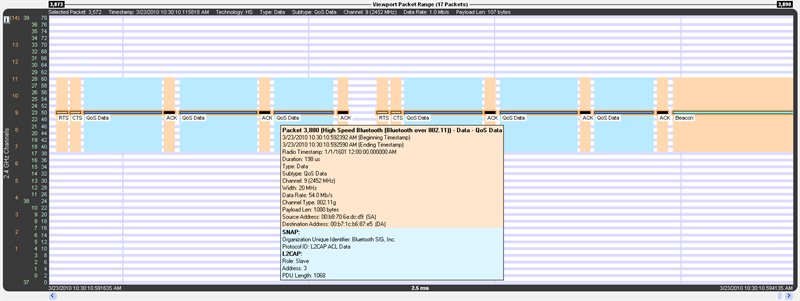
High-speed Bluetooth packets have a blue frequency box and a two-tone tool tip