low energy Packet Discontinuities
The following figure depicts a discontinuity between two packets.
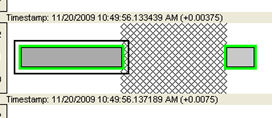
Bluetooth® low energy Packet Discontinuity
To keep the timeline and the throughput graph manageable, big jumps in the timestamp are not represented linearly. Instead, they are shown as discontinuities. A discontinuity exists between a pair of packets when the timestamp delta (the timestamp of the second packet minus the timestamp of the first packet) is (1) more than 4.01 seconds or (2) is negative. The reason that the discontinuity trigger is set at 4.01 seconds is because the maximum connection interval time is 4 seconds.
A discontinuity is indicated by a cross-hatched pattern drawn between two packets and a corresponding vertical dashed line in the throughput graph. When the timestamp delta is greater than 4.01 seconds, the discontinuity is a cosmetic convenience that avoids excessive empty space. When the timestamp delta is negative, the discontinuity is necessary so that the packets can be drawn in the order that they occur.