Throughput Displays
Throughput is payload over time. There are 3 categories of throughput:
Average and 1 Second Packet Throughput
The figure depicts the Average and 1 Second Packet Throughput displays. This display appears when you select the Packet Throughput radio button.
- Average Packet Throughput is the total packet size over the entire session divided by the total time. Total time is calculated by taking the difference in timestamps between the first and last packet.
- 1-Second Packet Throughput is the total packet size over the most recent one second.
- Width = peak =: This displays the maximum throughput seen so far.
- A horizontal bar indicates percentage of max seen up to that point, and text gives the actual throughput.
Average and 1 Second Payload Throughput
The figure depicts the Average and One Second Payload Throughput display. This display appears when you select the Payload Throughput radio button.
- Average Payload Throughput is the total payload over the entire session divided by the total time.
1-second Payload Throughput is the total payload over the most recent one second.
- Width = peak =: This displays the maximum throughput seen so far.
Note: 1-second throughput behaves differently than average throughput. In particular, while average throughput can be very large with only a couple of packets (since it’s dividing small packet or payload size by small time), 1-second throughput can be very small since it divides by an entire one second.
Throughput Graph
The following figure depicts the Throughput Graph.
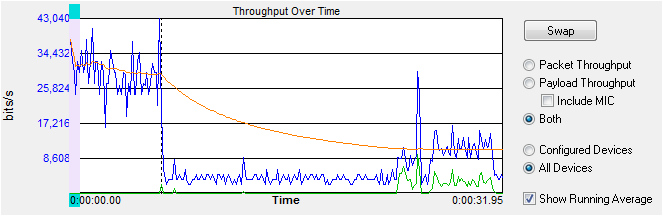
Bluetooth low energy Timeline Throughput Graph
The Swap button switches the position of the Timeline and the Throughput graph.
Selecting Throughput Display
- Selecting Packet Throughput displays just the Packet Throughput in graph form and displays the Average and Average and 1 Second Packet Throughput on the left side of the dialog. The y-axis numbers appear in blue.
- Selecting Payload Throughput displays just the Payload Throughput in graph form and displays the Average and Average and 1 Second Payload Throughput on the left side of the dialog.. The y-axis numbers appear in green.
- Selecting Include MIC will include the transmitted 32 bit Message Integrity Check data in the throughput.
You may want to include Message Integrity Checks in your throughput even though MIC is not application data. MICs are transmitted and you may want to included in the throughput as a measure of how active your radio was.
In this example the 1 Second Payload Throughput is 1,360 bits/sec when Include MIC is not checked. By checking the Include MIC box the MIC data is included in the throughput data and 1 Second Payload Throughput increases to 1,840 bits/sec. This capture file has 15 MICs in the last second of the file. A MIC is 32 bits for a total of 32 bits X 15 MICs = 480 bits.
The easiest way to view MIC data is to use the Frame Display.
- Using the Decoder pane scroll through the frames until LE Data shows "Encrypted MIC".
- Place the cursor on the Encrypted MIC data and while holding the left mouse button drag the field to the Summary pane.
An Encrypted MIC column is added to the Summary pane.
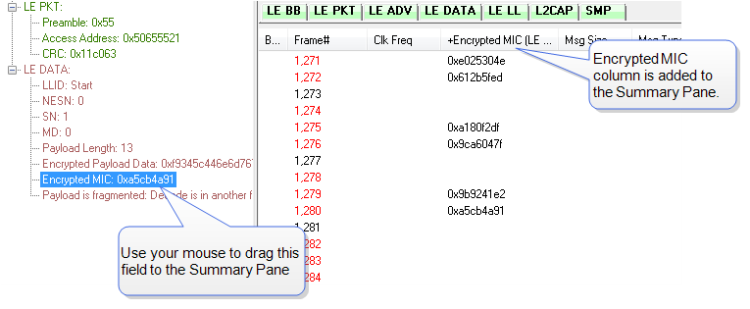
Creating Encrypted MIC in Frame Display Summary pane